By Sarah Lippert
Equitable access to a safe home, quality education, and healthy food can change the trajectory of a child’s life. These resources — plus others like air quality, economic opportunities, and a social safety net — help to foster comprehensive development more likely to result in healthy, productive adults.
Measuring and mapping the quality of these resources and conditions in neighborhoods across the U.S. for a decade, the Child Opportunity Index (COI) continues to be a powerful tool helping local and national organizations and governments evaluate children’s access to these resources, as well as the inequities in their regions, and address the gaps head-on.
Dolores Acevedo-Garcia, the Samuel F. and Rose B. Gingold Professor of Human Development and Social Policy and director of the Institute for Child, Youth and Family Policy (ICYFP) at Heller, spearheads diversitydatakids.org, an equity-focused research initiative dedicated to filling the gap in community-level data on social determinants of health and home of the COI. Acevedo-Garcia and her team of more than a dozen ICYFP and Heller colleagues released the first COI in 2014 and have just issued COI 3.0.
“The main driver of releasing new versions of the COI has been the incredible demand we’ve had from users of the index,” says Acevedo-Garcia. “As organizations have begun to rely on the COI to guide their work and analyze their impact, the need for more comprehensive and current data has grown, and we’re excited to be releasing new versions annually going forward.”
The COI 3.0 includes critical new metrics, like access to broadband internet and prevalence of nonprofits. The importance of access to these two resources was underscored by the COVID-19 pandemic, when work and education became home-based and dependent on a functioning internet, and community resources from nonprofits became paramount.
Another key addition to diversitydatakids.org is the inclusion of historical data from the racist 1930s Home Owners’ Loan Corporation neighborhood ratings, what has become known as redlining. These data illustrate the development of racially-segregated neighborhoods and disinvestment in predominantly minority neighborhoods from nearly a century ago, and allow users to map and see correlations between those historic borders and the conditions in today’s neighborhoods as measured by the COI.
“What we’re seeing is that neighborhoods redlined in the 1930s tend to have much lower child opportunity and life expectancy, even today,” says Acevedo-Garcia. “This reinforces our previous findings that the patterns of inequities that the COI highlights have been driven by racist policy decisions, and that we have to continue to raise awareness about the extent of the inequities children are facing.”
The extent of interest and wide range of applications of the COI are exciting outcomes that Acevedo-Garcia couldn’t have predicted a decade ago. Users include large-scale organizations such as the Chicago Department of Public Health, the Children’s Hospital Association (representing 220 children’s hospitals across the country), and local organizations utilizing the data to drive impact.
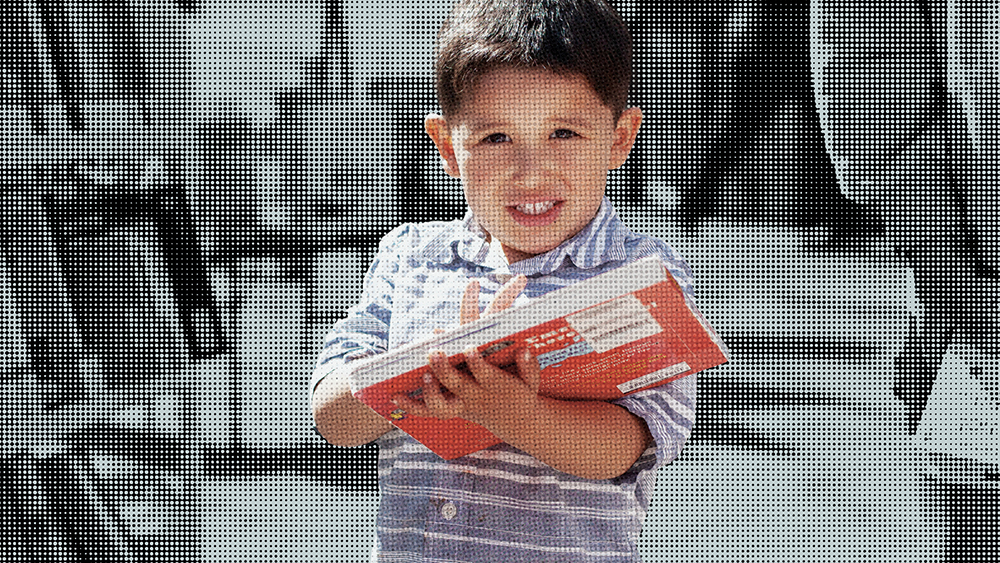
The Little Read Wagon, a literacy initiative from the San Antonio Public Library, uses COI data to identify which neighborhoods to visit for its “Let’s Play” events. These events allow young children to pick out new books to keep.
These utilization successes have led to the first state bill that “names the COI explicitly in the legislation.” Passed in California in 2022, the bill prioritizes racial equity and economic justice in the expansion of early childhood programs and uses the COI as one of the neighborhood-level evaluation tools.
For Acevedo-Garcia, who has spent decades studying the ways that structural racial inequality impacts inequities in place-based social determinants of health, the widespread use of COI 3.0 is a testament to her commitment and that of her colleagues to this important work.
