Prevalence of Parents with Disabilities in the United States
[Download PDF | Plain-language version]
Frank Li, Miriam Heyman, Ilhom Akobirshoev, Zach Williams, & Monika Mitra · August 2022
The number of U.S. parents with disabilities is large and increasing. Many people with disabilities become parents, but population estimates in the U.S. vary (Sonik et al., 2018).
It is imperative to have accurate, detailed, and up-to-date information about the prevalence of disabled parents in order to implement adequate policies for disabled parents and their families. This information should include data about specific disability types, since there are unique circumstances associated with specific disabilities.
To address this need, we used from the American Community Survey (ACS) 5-year data, 2016–2020, to explore the prevalence and characteristics of parents with disabilities, including racial and ethnic background and disability types. The ACS is a program of the United States Census Bureau that surveys about 3.5 million households in the country every year, and thus is the largest and most thorough survey of the U.S. population. In our analyses, we excluded people living in group quarters, and we were left with a sample of 15,195,435 records of individuals.
We considered parents to be adults (18 years or older) living with one or more minors (under 18 years) and presumably having responsibility for the minor(s). We defined parents with disabilities as parents that reported having one or more of the following: cognitive difficulty, ambulatory difficulty, independent living difficulty, self-care difficulty, vision difficulty, or hearing difficulty.
Our analyses[1] provided the following estimates:
There are about 65.9 million parents in the United States; 4.4 million parents (ages 18+) have a disability.
- 599,090 parents with self-care disabilities
- 927,110 parents with vision disabilities
- 976,950 parents with hearing disabilities
- 1,270,110 parents with independent living disabilities
- 1,810,340 parents with ambulatory disabilities
- 1,672,150 parents with cognitive disabilities
Note that many parents have more than one disability, and as a result, these numbers do not sum to 4.4 million.
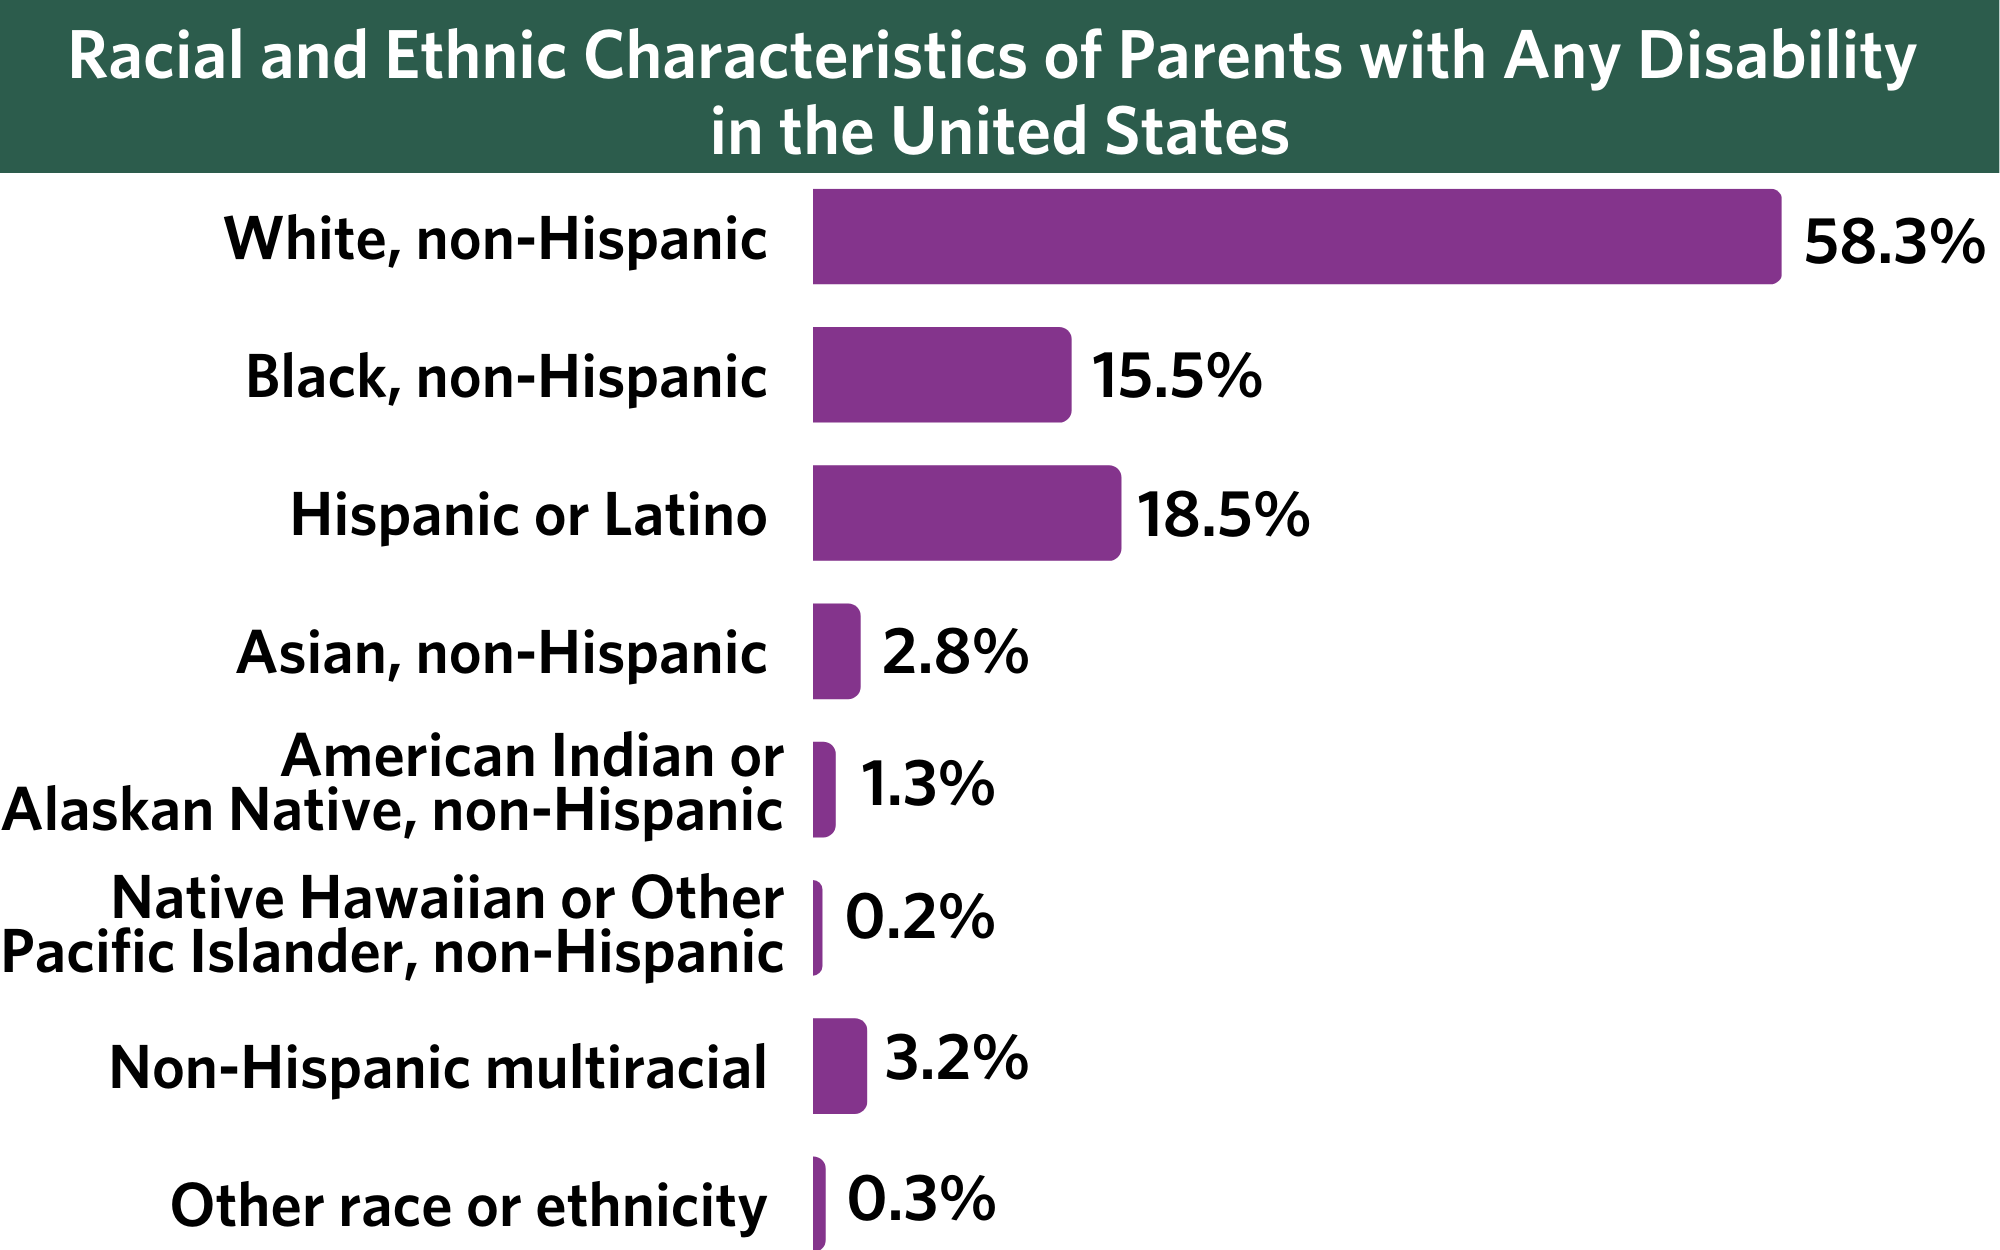
 Of parents with any disabilities, 58.3% percent are non-Hispanic White, 15.5% are non-Hispanic Black, 18.5% are Hispanic or Latino, 1.3% are non-Hispanic American Indian or Alaskan Native, 2.8% are non-Hispanic Asian, 0.2% are non-Hispanic Native Hawaiian or Other Pacific Islander, 3.2% are non-Hispanic multiracial, and 0.3% have another race or ethnicity.
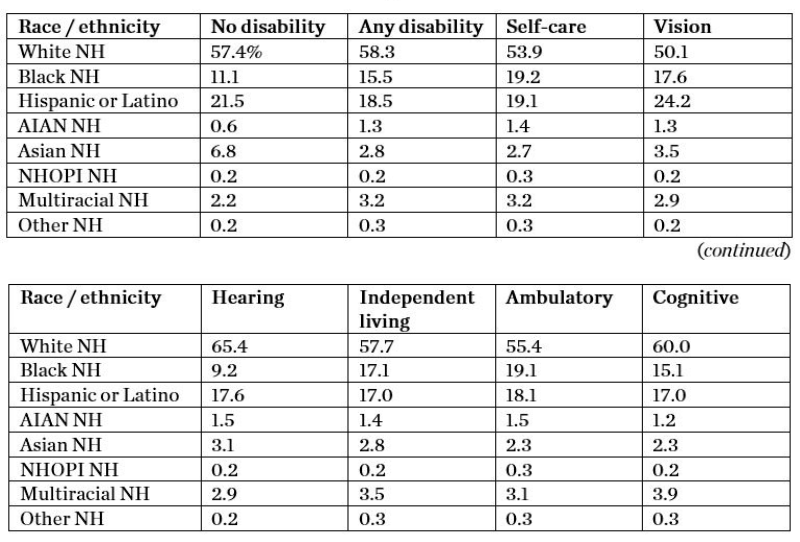
Table 1 shows percentages for each race/ethnicity by type of disability.
Table 1. Racial/ethnic background of U.S. parents with disabilities by presence and type of disability, 2016–2020

NOTES:
Percentages may not sum to 100 due to rounding.
All racial/ethnic groups presented here are mutually exclusive.
Disability subtypes presented are not mutually exclusive; an individual may experience several types of disability and would be included here in each relevant column.
All differences between the no-disability cohort and each disability cohort (any, self-care, etc.) are statistically significant (p<0.001).
Parents with disabilities experience poverty at higher rates than parents without disabilities. While 11.4% of nondisabled parents experience poverty, 27.3% of parents with any disability experience poverty. Table 2 shows the percentages of parents in poverty by type of disability.
Table 2. Parents living in poverty by type of disability, 2016–2020

NOTES:
Disability subtypes presented are not mutually exclusive; an individual may experience several types of disability and would be included here in each relevant column.
All differences between the no-disability cohort and each disability cohort (any, self-care, etc.) are statistically significant (p<0.001).

These estimates are a critical step towards supporting and improving the life circumstances of disabled parents in the United States. Documenting the prevalence of disabled parents can shape policies and programs for disabled parents and their families, which will reduce the disparities that they currently confront. Further data, methodology, and other information is available on the website of The National Research Center for Parents with Disabilities.
Reference
Sonik, R. A., Parish, S. L., Mitra, M., & Nicholson, J. (2018). Parents with and without disabilities: Demographics, material hardship, and program participation. Review of Disability Studies: An International Journal, 14(4), 1–20. https://rdsjournal.org/index.php/journal/article/view/822
Note
[1] The ACS data include weights to account for the complex structure of the survey sampling. Use of these weights allows calculation of nationally representative estimates.
