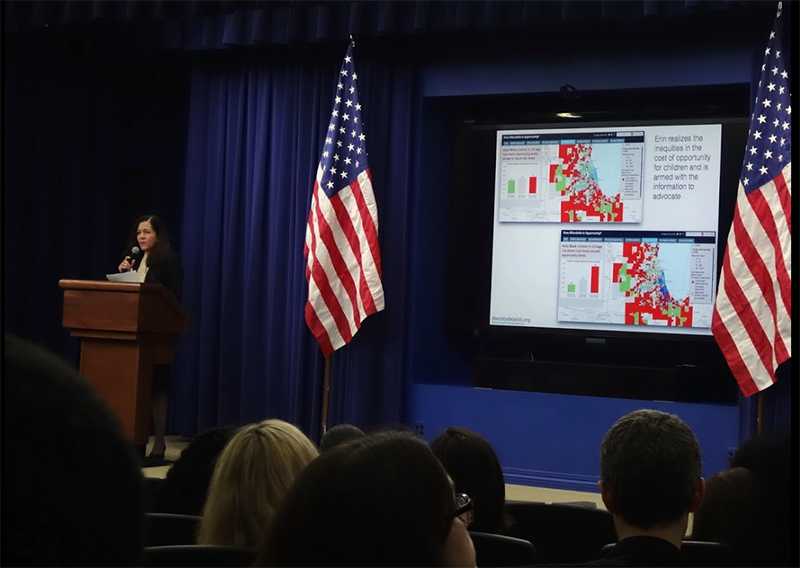
Earlier this month, team members from the Institute for Child, Youth and Family Policy were in Washington, D.C. to help launch the White House’s Opportunity Project, an open data initiative to improve economic mobility for all Americans. The project follows President Obama’s call in his most recent State of the Union Address to use the latest technology to provide more equitable access to critical resources that adults and children need to succeed, such as jobs, housing, quality schools and transportation.
The White House invited ICYFP and several other external partners to combine the power of their own digital data tools to build a comprehensive source of information for civic organizations, nonprofits and local government.
By tapping into its diversitydatakids.org project, the ICYFP team created a “How Affordable is Opportunity? Tool which allows users to create data maps that show the cost of neighborhood opportunity for children and whether there are racial and ethnic inequities in this cost. Users can also browse narrative story maps for 16 metropolitan areas. Diversitydatakids.org eventually plans to create narrative maps for the 100 largest metro areas in the United States.
ICYFP Fellow Erin Hardy and institute Director Dolores Acevedo-Garcia (pictured above at the White House press conference) talked with Heller Communications about the tool and the importance of partnering with the White House on the larger data initiative.
Heller Communications: What does your contribution to the Opportunity Project allow users to do that they couldn't before, and why is that important?
Erin Hardy: The tool we built for the Opportunity Project shows for the first time that there is a cost associated with neighborhood opportunities for children, and what’s more, shows that the cost of opportunity is unequal by race and ethnicity. By neighborhood opportunity, we mean all the neighborhood conditions and resources that help children thrive, such as nearby quality schools and early education programs, healthy food options, parks and green spaces, etc. By cost, we mean the cost of living in a neighborhood, in terms of what fraction of a household’s income is spent on housing and transportation expenses. Our users are primarily policymakers and advocates who want to address longstanding and pervasive inequities by expanding access to opportunity in their metropolitan areas.
Before the Opportunity Project, visitors to diversitydatakids.org could create Child Opportunity Index maps to get data on the extent of racial and ethnic inequities in child opportunity for all neighborhoods in the country’s 100 largest metro areas. They could also use the Location Affordability Index from the U.S. Department of Housing and Urban Development (HUD) and the Department of Transportation to see cost maps for their specific areas.
The contribution of this new tool is that we integrated these two data sets to create a new, more comprehensive measure of the cost of neighborhood opportunity. Also, the tool presents narrative story maps, which are a streamlined and visually compelling way to present this very complex information, so the user can quickly get the main equity takeaway for a given metro area.
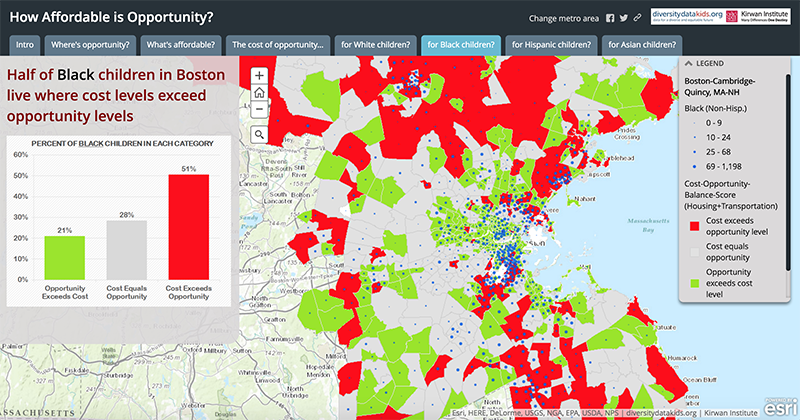
In many metro areas, the takeaway is that black and Hispanic children live in neighborhoods where housing and transportation costs are excessive relative to the level of opportunity in the neighborhood. However, the extent of inequity does vary across metro areas. This tool is important because it tells a new story of “double jeopardy” for black and Hispanic children, in which they are not only more likely to live in lower opportunity neighborhoods than white children, but they also face relatively higher costs to do so. Users can build custom maps, or they can directly incorporate the narrative story maps into their work with no additional effort on their part.
HC: What are your thoughts on being included in this White House initiative?
Dolores Acevedo-Garcia: It was an honor to be invited to participate in this initiative. It is very important for us to be recognized both for the research we have done on neighborhood conditions that matter for children and for our focus on child equity. During the event at the White House, our tool was featured in the section on “National Policy Context” because our work highlights patterns of inequity that affect the entire U.S. population. The Obama administration has sent a strong message about the importance of providing Americans with equal access to opportunity, and specifically about the negative impact of housing segregation. We are delighted that our work can play a part in describing and hopefully addressing the vast inequities our children, in particular, are facing.
EH: It was very important for diversitydatakids.org to be part of the Opportunity Project, as the initiative is perfectly mission-aligned with our work. The core idea of the Opportunity Project is to use data and technology to expand access to opportunity. We do so every day by using data and technology to advance research, analysis and monitoring of inequities.
The participants were very diverse, from for-profit tech companies to academics. We were a unique participant in that we had both the subject matter expertise and the tech piece from our experience creating web tools for non-academic users. I think we offered an important perspective on the importance of synthesis and interpretation of the data, which means making meaning of the data for our users. With data and technology moving at lightning pace, there is an urge to make every piece of information available and customizable by the user, but users can sometimes drown in the sea of data. Our tool was distinct in its use of narrative story maps that made meaning of the data for our users, but we were only able to do that because of our subject area knowledge.
We also learned an enormous amount about how to further streamline and simplify our tools and messages for non-academic audiences thanks to many insights from White House staff and other participants.
HC: This is one way to use the diversitydatakids.org data—do you foresee incorporating that data into other projects in other ways?
We are delighted that our work can play a part in describing and hopefully addressing the vast inequities our children, in particular, are facing.
DAG: While the movement to “democratize data” is not new, there is an increasing recognition that open data per se may not improve access to information on neighborhood opportunities. Thoughtful, simple and user-friendly interfaces are needed to make data accessible and relevant. The analytic work behind the “How Affordable is Opportunity? Tool reflects years of work, including the time spent developing the previous tools, including the Child Opportunity Index and the Location Affordability Index, which we combined to create it. Yet, from a user perspective, the end product is a visually compelling and concise tool that can help inform policymakers and other stakeholders interested in improving equity in child neighborhood opportunity.
The White House Open Opportunity Data initiative made us more aware of the importance of developing data tools with a user-centered design process. This means identifying the needs of the user and presenting the data in a way that speaks directly and eloquently to their needs. Continuing with our focus on population level analysis of equity patterns, we want to develop simple and compelling tools for stakeholders interested in improving equitable access to neighborhood opportunity across their region.
EH: We made many great connections through this initiative and now that a diversitydatakids.org tool is part of a federal website, it should even further expand our reach. At the federal level, we see lots of potential for this tool to be used by grantees of HUD as they complete their fair housing assessments. There are also opportunities to connect to efforts in the education and health domains, with new data requirements for schools under the recently passed Every Student Succeeds Act (ESSA), and for hospitals under the Affordable Care Act (ACA). We also see opportunities to connect this tool with data initiatives of large national foundations focused on issues of equity in child health and wellbeing.
Read more about the Opportunity Project in this CityLab article