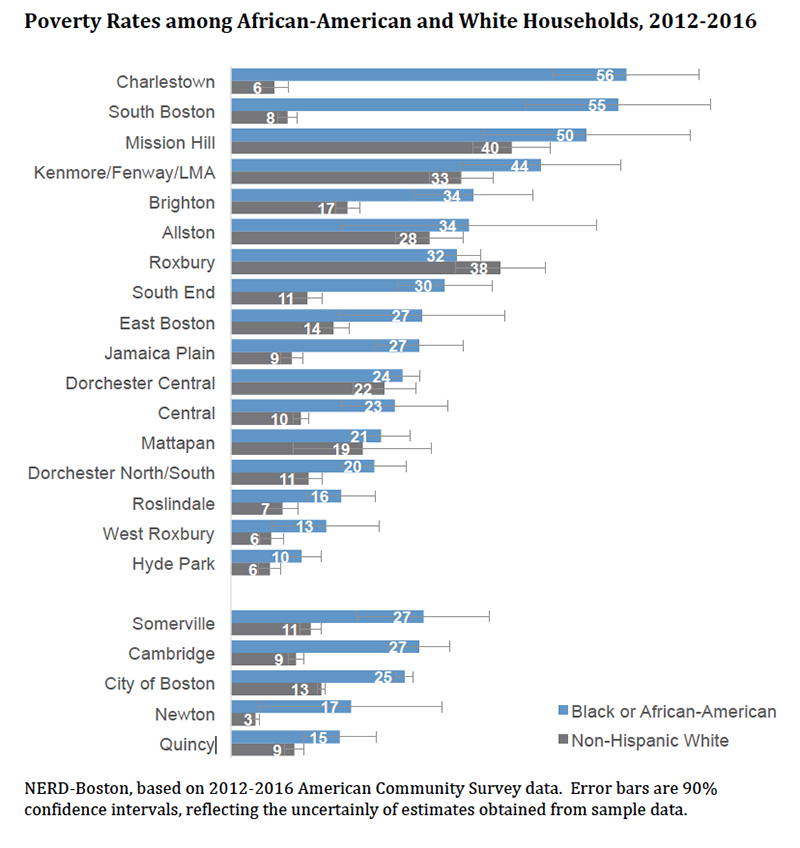
WALTHAM, MASS. (August 6) — Twenty-five percent of African-American households in Boston live below the poverty line, but this statistic conceals huge inequities across neighborhoods, ranging from 10 percent in Hyde Park to 56 percent in Charlestown.
This is according to “NERD Boston” a new, open-source database launched today by the Institute for Child, Youth and Family Policy at Brandeis University's Heller School for Social Policy and Management. The data also reveal large racial and ethnic inequities within neighborhoods: the poverty rate for African-American households is three times higher than for white households in the South End and Jamaica Plain, seven times higher in South Boston, and nine times higher in Charlestown.
The Boston edition of the National Equity Research Database (NERD Boston) is a trove of 286 socio-economic indicators focused on racial and ethnic equity and covering a wide range of subjects, including demography, education, employment, health, housing, earnings, ancestry and more. The initial release incorporates data from the U.S. Census Bureau’s American Community Survey, including trend data available from 2009 to 2016.
NERD Boston allows for easy comparisons of 17 Boston neighborhoods with the city of Boston and other municipalities in the metro area. It also includes data for Massachusetts, New England and the U.S.
This database is a product of the Institute’s flagship research project, diversitydatakids.org. Like diversitydatakids.org, NERD Boston has a unique focus on equity, and provides 160 of its 286 indicators by race and ethnicity. The full National Equity Research Database—containing data on racial/ethnic equity from the national to local level for the entire U.S.—will be released later this year.
“The city of Boston is becoming more diverse, but stubborn inequities persist across racial and ethnic groups and neighborhoods,” says research director Clemens Noelke. “Looking at statistics for the entire city or for the city’s more diverse neighborhoods can mask these large inequities, and create a misleading picture of population and socioeconomic characteristics across the city. You need data that is local and broken down by race and ethnicity to gain a better understanding of what’s happening in the neighborhoods, city and the metro area.”
NERD Boston is an incredible resource for researchers and analysts in the public, private and nonprofit sectors—including journalists. Data files and a user guide are available for download from their website, allowing anyone who has worked with data in spreadsheet format to look up statistics or run analyses instantly.
Best of all, it’s free and open to the public, as the work is currently funded by the W.K. Kellogg Foundation.
“We believe it’s important for local data on racial and ethnic equity to be available and easily accessible, nationwide. NERD Boston brings a new level of detail to conversations around racial and ethnic equity in our city. That’s information that anyone should be able to access—and use, “ says Dolores Acevedo-Garcia, director of the institute and diversitydatakids.org.
Take Boston’s poverty rates, for example. Before NERD Boston, users seeking socio-economic information by race and ethnicity within Boston neighborhoods had to obtain data for small geographic units buried deep within the Census Bureau website. They then had to aggregate that data up to the neighborhood level to produce reliable, meaningful statistics.
Existing data profiles and reports reflect these barriers, and focus on numbers that are easier to obtain: poverty rates for the entire city, broken down by race and ethnicity, or overall poverty rates by neighborhood.
The graphic below, using NERD Boston data, shows how misleading those statistics can be. Using the citywide poverty rate conceals huge inequities across neighborhoods, but reporting neighborhood-wide statistics can hide inequities by race and ethnicity.
For example, poverty rates for Charlestown and South Boston are 19 percent and 17 percent, respectively, but these numbers conceal huge differences by race. In Charlestown, poverty rates are 56 percent for African-American households and six percent for white households. In South Boston, African-American poverty is 55 percent, versus 8 percent for white households.
With NERD Boston, users can perform similar analyses for 160 data indicators available by race and ethnicity, providing an unprecedented look at inequities within and across Boston neighborhoods and municipalities in the Boston metro area.
In 2019, the diversitydatakids.org team plans to update NERD Boston, adding more data indicators and geographies, and new years of data as they become available.