By Nomi Sofer '91
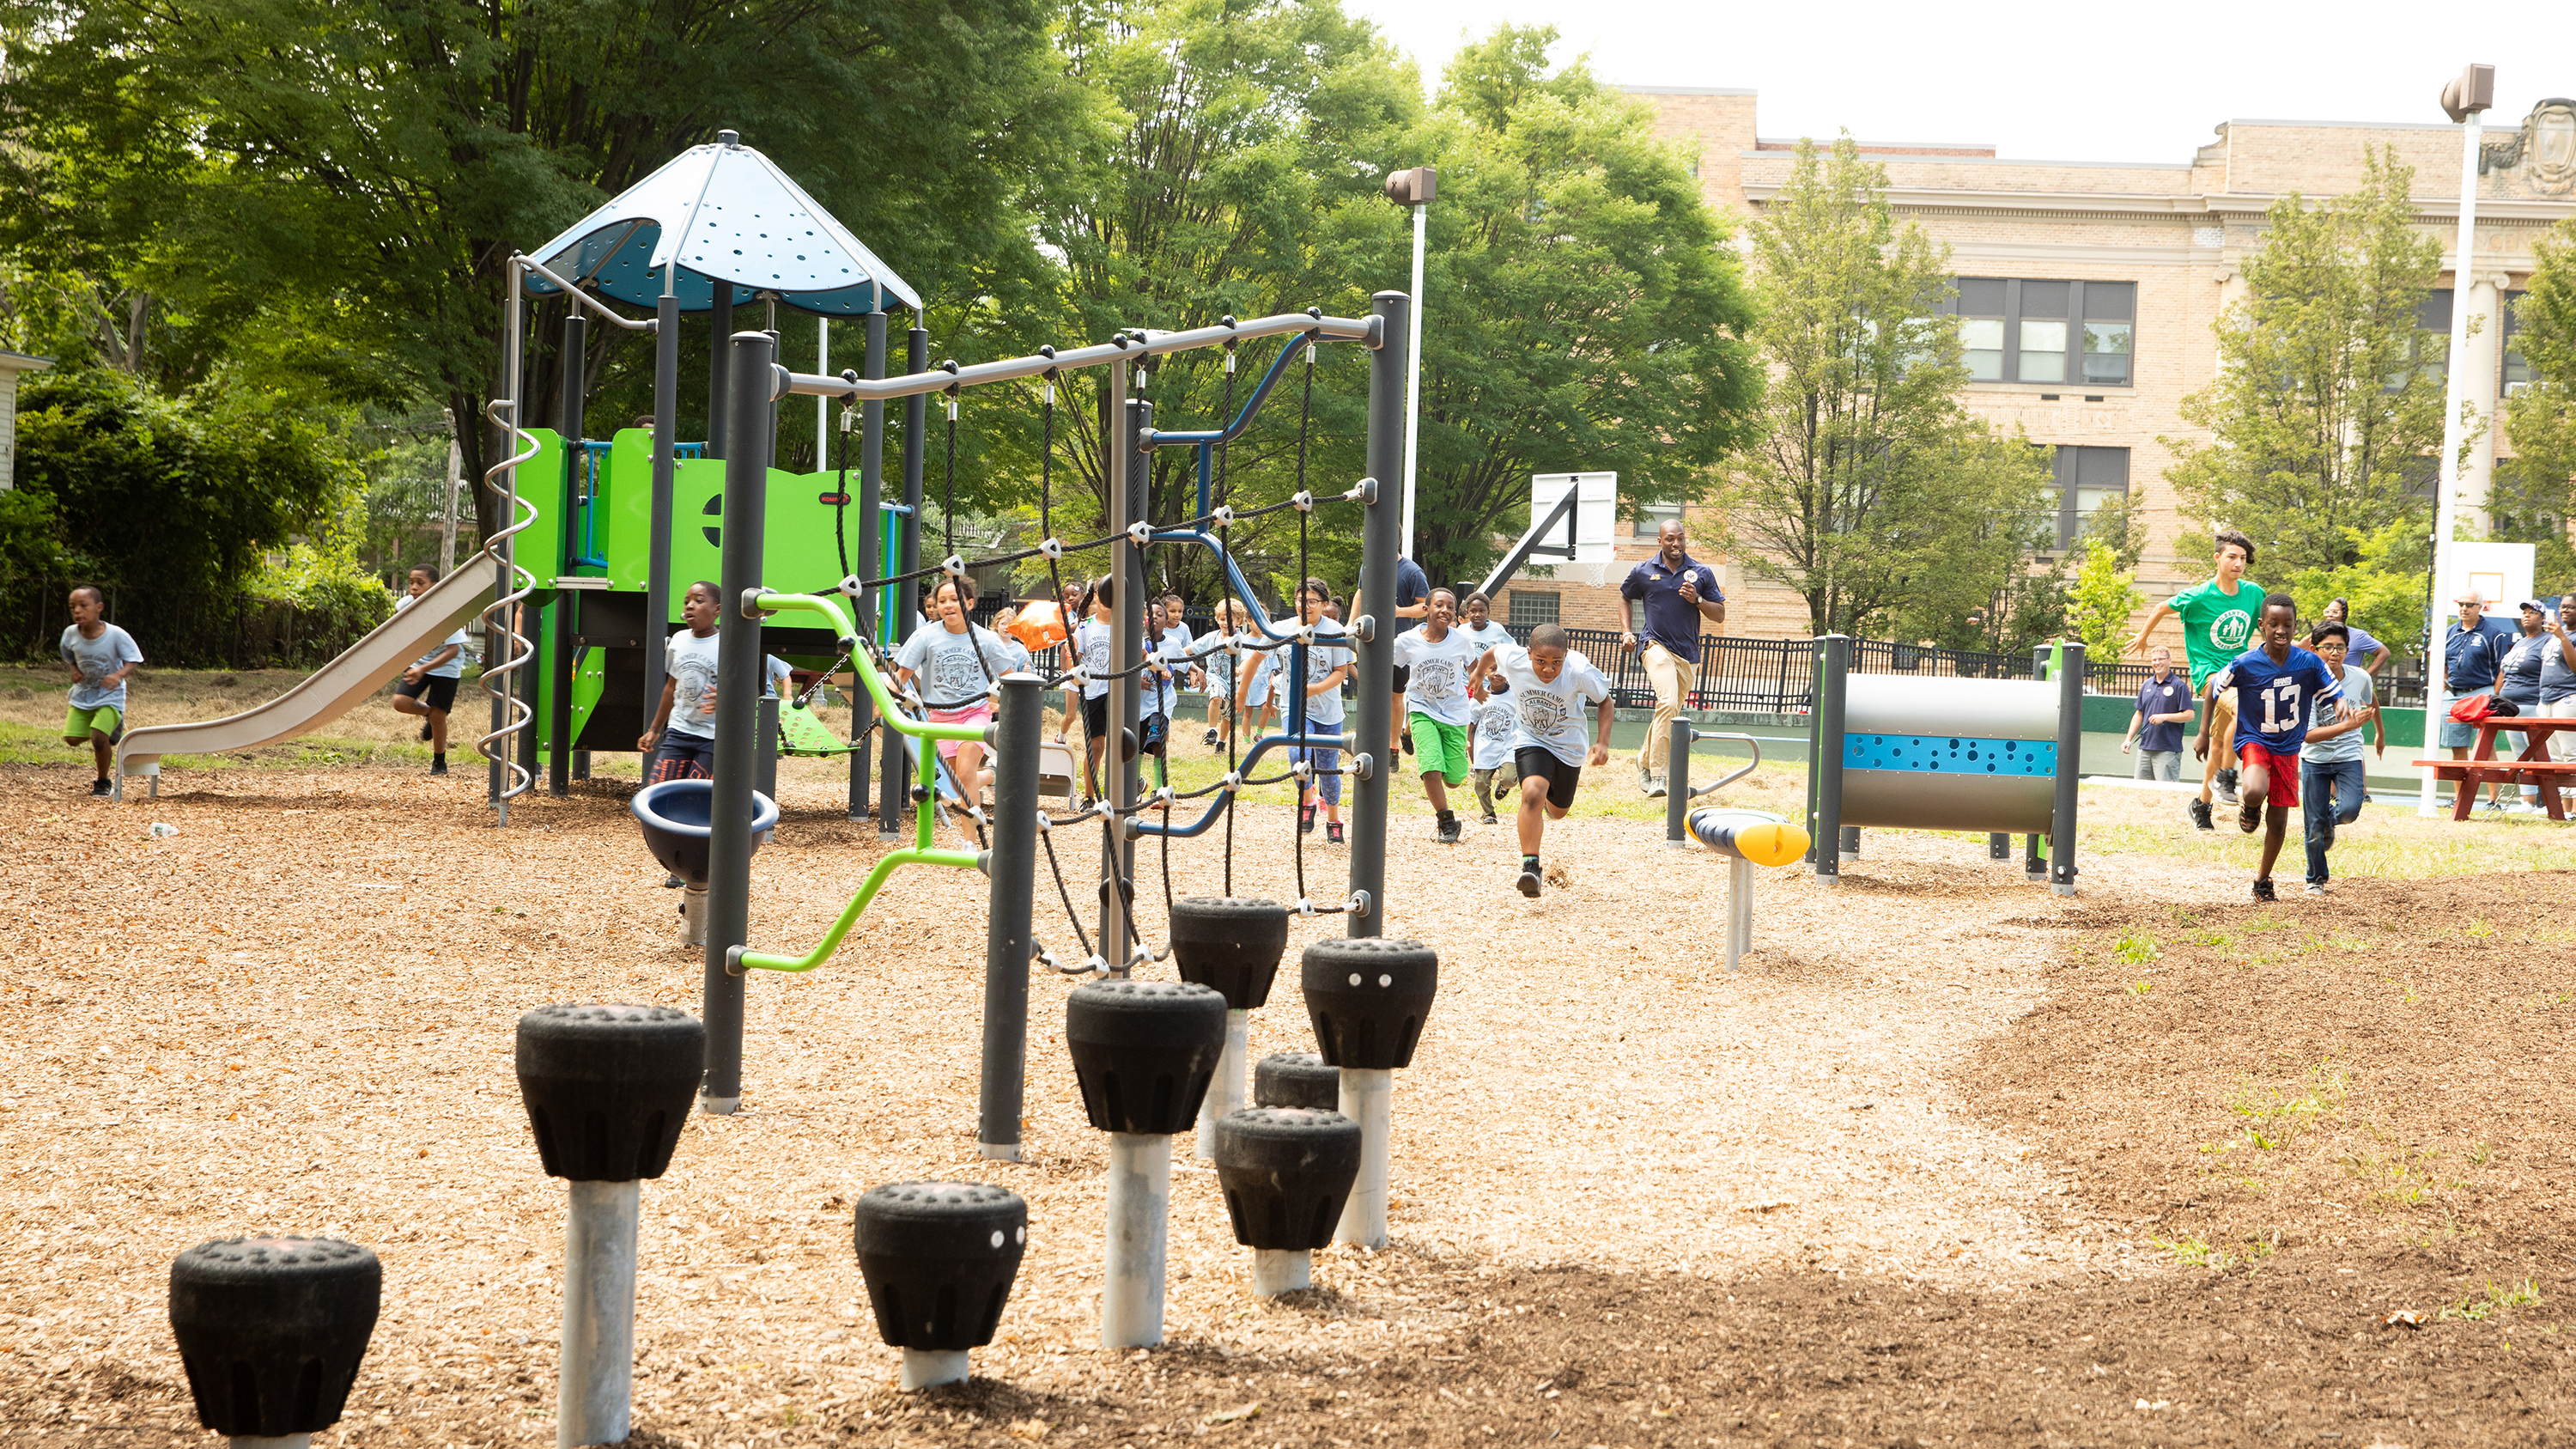
On a sunny day in August, children shrieked with laughter as they chased each other across a gleaming new playground at Madison Avenue Park in Albany, New York, while their parents exercised on equipment nearby — a sight that would have been unfathomable just four years ago.
That’s when Jonathan P. Jones, Albany’s commissioner for recreation, youth and workforce services, first encountered the Child Opportunity Index (COI), created by Heller’s Institute for Child, Youth and Family Policy (ICYFP). The COI’s finding that Albany was the worst place for black children to live among the 100 largest U.S. metropolitan areas was both shocking and galvanizing.
“That data was my awakening,” Jones recalls. “I was relatively new in the role, and the data showed me what my main focus needed to be: thinking about how to create more equitable neighborhoods.”
That’s exactly what ICYFP Director Dolores Acevedo-Garcia, the Samuel F. and Rose B. Gingold Professor of Human Development and Social Policy, wants to hear.
“All children deserve to live in safe, healthy neighborhoods, but many U.S. children don’t have access to these conditions,” she says. “The Child Opportunity Index allows communities and policymakers to see where inequities exist and take steps to reduce disparities. We’re thrilled that leaders in Albany saw the data and took action to invest in parks and playgrounds in neighborhoods where children who have the least access to opportunity live.”
Developed in 2014 by ICYFP researchers in collaboration with the Kirwan Institute for the Study of Race and Ethnicity, the Child Opportunity Index has been widely used to initiate conversations about unequal access to opportunity and to spur actions to increase equity. From Albany, New York, to Pinellas County, Florida, to Boston, Massachusetts, policymakers, community organizers, nonprofit leaders and citizens are using the COI to improve the lives of the youngest members of their communities.
The Child Opportunity Index
For children across the United States, opportunity might mean attending well-funded schools, participating in community sports, or having access to grocery stores and restaurants with nutritious food. But knowing which children live in neighborhoods with — or without — those conditions wasn’t possible before the ICYFP team created the Child Opportunity Index.
“The COI is an invaluable resource for anyone who needs up-to-date information on the quality of neighborhoods children grow up in,” says Clemens Noelke, ICYFP's research director. “It can be used to map the needs and resources of communities with a focus on children, to design and target interventions, to highlight racial and ethnic inequities in access to neighborhood opportunity, and to track changes in neighborhood opportunity over time.” Today, the COI is available online at diversitydatakids.org, providing a rich, detailed portrait of the neighborhoods where U.S. children live.
The COI aggregates indicators of the conditions children need to live healthy lives and to grow into productive adults, including access to quality child care and schools; proximity to healthy food outlets; availability of parks, recreation opportunities and safe housing; as well as the socioeconomic conditions of adults in their neighborhoods. The COI also measures exposure to adverse conditions like air pollution, excessive heat and toxic waste sites. Unlike many data sources that measure a single factor that shapes children’s lives, such as the poverty rate, or a group of closely related factors, like school achievement measures, the COI includes indicators from three domains: education, health and environment, and socioeconomic conditions.
The COI reveals vast inequities in access to opportunity for black and Hispanic children. Nationally, about 50% of children in the United States are now members of racial or ethnic minorities, and that percentage is higher in many major cities. These children live in neighborhoods that lack the conditions all children need for healthy development. By revealing these inequities, the COI can be a catalyst for action.
Demand for the COI took ICYFP researchers by surprise, and users’ requests for enhancements to the tool prompted the Heller team to develop the Child Opportunity Index 2.0, which was released January 2020. COI 2.0 includes new data and features that make it an even more powerful tool for tracking and tackling inequity.
The updated COI allows comparisons between metro areas across the United States. Previously, users could compare neighborhoods in a metro area like Boston or Albany, but couldn’t compare Boston to Albany.
“For the first time, there is a single, consistent metric of child opportunity for every neighborhood in the United States,” says Acevedo-Garcia. “This means that we can get a complete picture of where opportunity is highest — and lowest. COI 2.0 allows us to see and talk about inequities in neighborhood opportunity in a way that wasn’t possible before. Those conversations can spark positive change in our communities.”
Digging Into Disparities in Florida
Pinellas County is a long, narrow stretch of Florida’s Gulf Coast, with a million residents spread among million-dollar beachfront homes and trailer parks. Disparities in income levels translate into unequal access to neighborhood opportunity for children, but these disparities are easily concealed by data collected and mapped at the ZIP code level.
That’s a challenge for an organization like the Juvenile Welfare Board (JWB), established in 1945 to address the needs of children and families in Pinellas County.
Starr Silver, JWB's strategic research manager, explains: “Take ZIP code 34695 — the Safety Harbor area. This ZIP code is comprised of four census tracts, and each tract has a different opportunity level, ranging from low to very high. If you simply look at average income at the ZIP code level, you don’t see those pockets of need.”
That’s why JWB turned to the Child Opportunity Index, which reports data at the census tract, or neighborhood, level. JWB combined its own rich data with the COI to help focus resource allocation and program development across the county and provide a mechanism for tracking change over time. Shared with the county’s network of eight neighborhood family centers, the COI allows local community leaders to identify needs specific to the census tracts in their service area and customize their services to match the needs of the children and families they serve.
“In one community, food insecurity may be a bigger challenge than leaders realized; in another, we might see that the percentage of single mothers in the community is much greater than the county average, or we’ll find that the portion of young children enrolled in preschool is much lower than the county average,” Silver explains. “When local leaders have data that’s specific to the census tracts they serve, they can be more strategic in providing services, reducing barriers and raising funds.”
For Denise Groesbeck, who served as strategic research manager during the years that JWB decided to create a customized version of the COI, the fact that it’s a composite is central to its value as a tool for increasing equity. “Family and neighborhood conditions have a compounding effect. The more adverse or beneficial conditions children experience, the lesser or greater opportunity they have for successful development,” she says. “That’s the beauty of the COI. It doesn’t show just one indicator. It produces a picture of the many factors that combine to create opportunity. That’s also what makes the COI a trusted data source for us.”
Building Trust in Boston
That need for trustworthy data that a community can mobilize around is at the heart of the Vital Village Network (VVN), which uses the Child Opportunity Index as the foundation for its community-based Data Dashboard, serving the Dorchester, Roxbury and Mattapan neighborhoods of Boston. Established by Boston Medical Center pediatrician and community leader Renée Boynton-Jarrett, the dashboard brings together data about the health and well-being of children and families from multiple sources in order to align family support services and resources with need, track progress on benchmarks for child well-being, and empower community members to use data to create change.
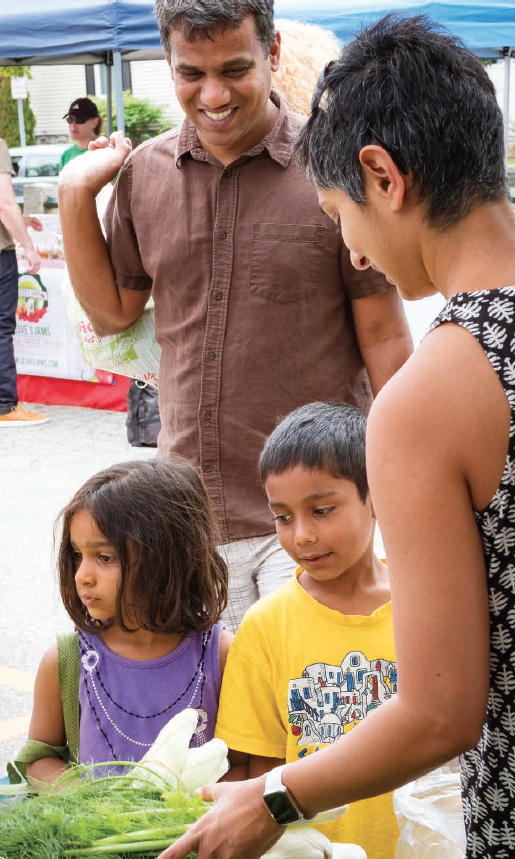
For example, VVN's Community Data Workgroup spurred the development of a food access app, which is being used by community members to locate sources of affordable, healthy food, ranging from food pantries to farmers markets. The app allows residents to share information about the quality and variety of food at various outlets, encouraging neighbors to seek out the freshest, most nutritious food and removing the stigma of using food pantries.
But getting to this point was a complicated journey that required buy-in from communities long wary of the “one-dimensional story data tells,” says Boynton-Jarrett. Single measures such as school achievement or crime levels that paint a community as “failing” or “dangerous” overlook community strengths and residents’ resilience, and can seem to blame the community for its challenges.
Because the COI is a relative measure, “it’s not looking at communities as individual places that happen to be performing well or poorly,” Boynton-Jarrett says. “The COI captures that these differences between communities are not random. It allows us to see that these differences are the result of a series of processes around where people can get access to housing, what types of resources were poured into neighborhoods with more opportunity, and which historical processes — redlining, illegal dumping — operate in concert so these neighborhoods arrived at where they were in relation to other communities.”
Her goal is to mobilize community members to use data from the COI and other sources to engage with policymakers, advocate for themselves and help develop programming to address community needs. To date, VVN has developed a task force to encourage male engagement in the lives of children, a program to advocate for and support breastfeeding for all mothers, and comprehensive trauma-informed prenatal services, among others.
Keeping Kids Active in Albany

A playground might not seem like the most important indicator of equity, but play is critical to children’s healthy development and success in school. For the city of Albany, it was clear after they looked at data from the Child Opportunity Index: Too many of Albany’s black children didn’t have access to well-kept, stimulating places to play.
That spurred Jones, who is the youngest commissioner for recreation, youth and workforce services in the city’s history and the first African American in the role, to bring the findings to the attention of Mayor Kathy Sheehan. They developed a five-year capital improvement plan to revitalize Albany’s highest-used and most in-need parks to increase equity and access to these resources for all of the city’s children, especially black children, who had historically been left behind.
Now, four years into implementing the $2 million plan, Jones and his team have revitalized 13 parks and playgrounds, creating safe, interesting and accessible spaces across the city. All of the renovated playgrounds are compliant with the Americans With Disabilities Act, and six playgrounds include fitness equipment designed for adults, allowing parents to exercise while their children play.
“One of my favorite things about the fitness equipment is that it brings dads into the park,” Jones says. “Kids and their parents are spending a lot more time in the revitalized parks. They used to stay for just a few minutes; now, because there’s something for parents to do and the equipment is designed to be both physically and cognitively challenging for kids, they’re staying for a couple of hours at a stretch.”
Convincing decision-makers to allocate resources to parks and playgrounds wasn’t easy, but the COI helped make the case with its detailed data — as it’s done across the country for communities committed to combating inequities.
Mayor Sheehan says, “The Child Opportunity Index really showed us, in stark numbers, what a lot of us already knew: that, particularly in this area, our poverty is concentrated in small neighborhoods, and that those concentrations of poverty that have happened over decades have resulted in neighborhoods that are the have-nots. That story of the haves and the have-nots was there in black and white. Nobody could argue about it anymore, or ignore it.”